Hey there, inquisitive Grade 6 students! Welcome to an exciting data detective challenge! Today, we will embark on an adventurous journey to decode secrets hidden within graphs and diagrams. Imagine yourself as a brilliant detective, using your sharp analytical skills to solve problems and answer questions based on visual data. Let’s dive in and uncover the magic of data visualization!
Understanding Data Visualization:
Before we dive into the thrilling detective work, let’s understand what data visualization is all about. Data visualization is the art of representing information through graphs, charts, and diagrams. These visual aids offer a clearer and more accessible way to understand complex data, helping us make sense of the numbers in a snap!
Cracking the Graph Puzzle:
As data detectives, we need to know how to analyze and interpret data presented in graphs and diagrams. Let’s explore the steps together:
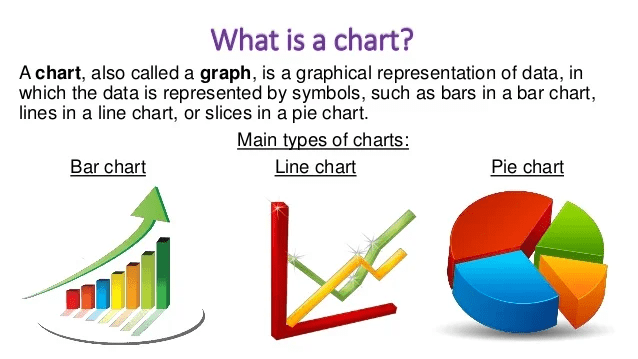
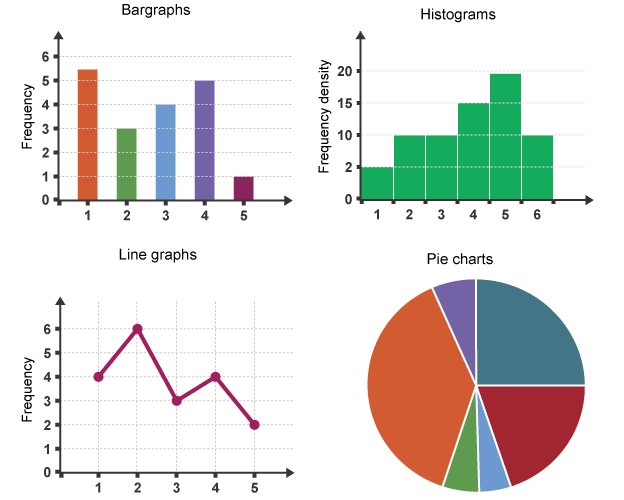
Identify the Type of Graph or Diagram: Pay attention to the visual representation. Is it a line graph showing trends over time? A bar graph comparing different categories? Or a pie chart depicting parts of a whole? Knowing the type of graph is the first step to cracking the puzzle!
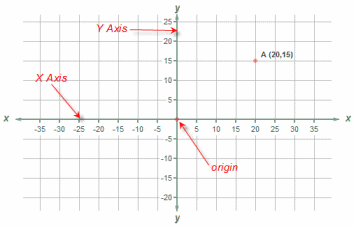
Read the Axes and Labels: Take a closer look at the axes (x and y) and labels of the graph. They provide essential information about what each axis represents and the units used. Understanding this information is crucial for interpreting the data accurately.
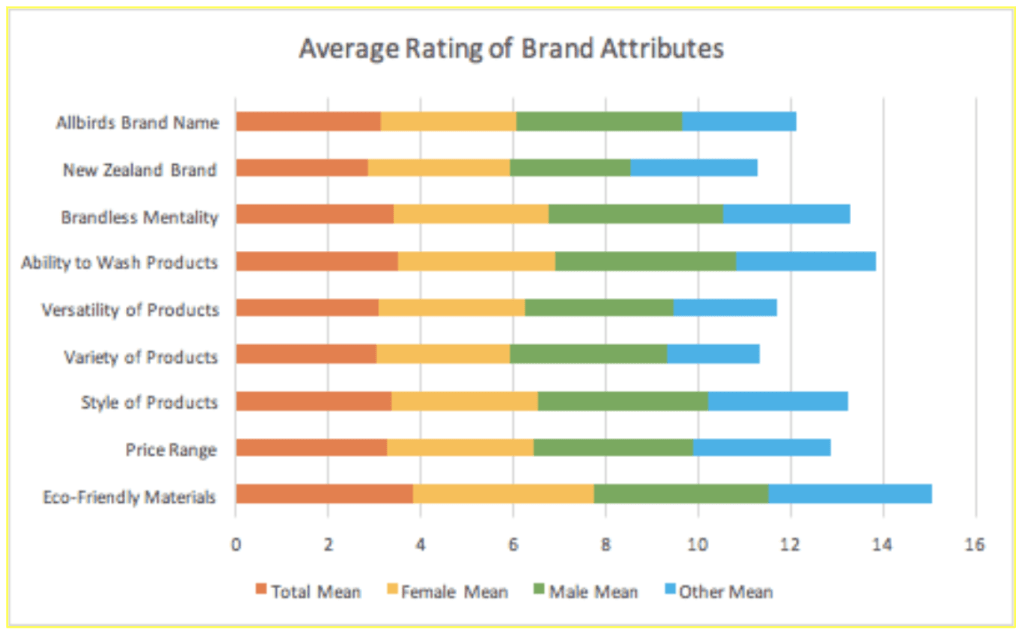
Analyze the Data Points: Look at the data points on the graph or the sections in a diagram. Are there any trends, patterns, or significant differences? By analyzing the data points, we can make informed deductions and answer questions.
Solving Data Detective Challenges:
Now, it’s time to put on our detective hats and solve some gripping data mysteries!
Mystery 1: The Temperature Trail: Interpret the line graph showcasing monthly temperatures. In which month was the temperature at its highest? Can you find the coldest month too?
Mystery 2: Sports Showdown: Examine the pie chart displaying favorite sports. Which sport is the most popular among the students? How many students chose that sport?
Mystery 3: Bookworm Race: Analyze the bar graph illustrating the number of books read by each student. Who read the most books? Who read the least?
Congratulations, accomplished data detectives of Grade 6! You’ve successfully unraveled data mysteries and mastered the art of interpreting information presented in graphs and diagrams. Armed with these skills, you can now make informed decisions, draw conclusions, and solve real-world problems with ease.
As you continue your data detective journey, remember that visual data representations are powerful tools that help us understand the world around us. Embrace the joy of discovering insights from numbers, and keep using your detective skills to make a positive impact on your surroundings.
Happy data detective adventures!
Please see related topic:
Unraveling Data Secrets: Becoming a Master Detective of Patterns and Trends
Data Detective: Unraveling Mysteries Through Exciting Methods
Data Detective Adventure: Unlocking Insights with Stem and Leaf Plots
Data Visualization Made Simple: Choosing the Right Tables and Graphs

2 thoughts on “Data Detective Challenge: Unraveling Mysteries through Graphs and Diagrams!”